Tracker diagnostics
Tracker diagnostics give you insights about how a tracker functions in the field, with a focus on the quality metrics related to data communication quality, geolocation determination quality and battery consumption.
Tracker diagnostics summary
The tracker diagnostics summary is displayed on the tracker's status page. Follow the procedure described in this task to view the status page of a particular tracker.
The information available in the diagnostics depends on the type and configuration of the tracker. The information shown on the tracker's status page is for example this one:
If your tracker also uses Wi-Fi or geobeacon localization, then some extra metrics will be shown.
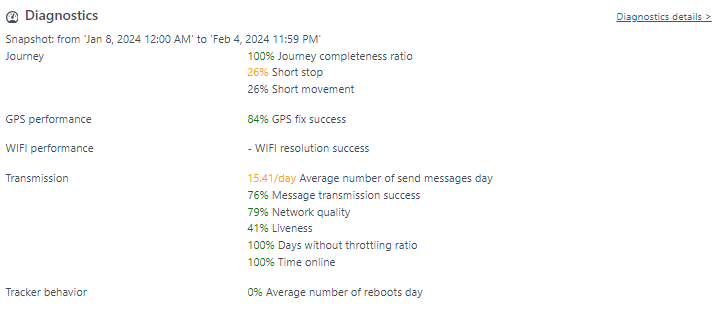
The diagnostics summary shows in the screenshot above contains a set of status and quality indicators:
- Tracker status and the timestamp of when the last message was received from this tracker.
- The Journey completeness ratio gives an indication of how much location data was successfully received.
- The Short movement indicator specifies whether short movements are registered by the tracker. If this indicator is high, it is recommended to change the tracker's configuration profile with a longer stop time-out value, in order to reduce battery consumption.
- The GPS performance indicator provides information about the success ratio for the tracker to determine its location using GPS. When this success ratio is low, changing the tracker's configuration may be required.
- The Battery indicator gives a visual indication of the current battery status
 and a prediction of the remaining battery
autonomy, based on battery type and past asset behavior.
and a prediction of the remaining battery
autonomy, based on battery type and past asset behavior. - The following Data Transmission related quality indicators may be displayed as
well:
- Average number of messages that the tracker sends on a daily basis. The more messages it sends, the sooner the battery will run empty.
- A network quality indication. This indicator is based on the quality of the network experienced by the tracking device during a one month period of time.
- The Days without Throttling ratio gives an indication of whether the tracker has been in throttling ("blocked" state) during the previous month or not.
- The Messages transmission success indicates what percentage of messages are successfully delivered.
- The Liveness indicator shows what percentage of messages are delivered in real-time. Note that unsuccessful deliveries can be resynchronized at a later moment in time.
- Time online shows whether the tracker has been in Offline status during the last month and how frequently.
Tracker diagnostics overview
The tracker diagnostic overview page can be accessed by going to the Asset View mode (follow the steps described in this task) and by clicking on the "Diagnostic" tab.
The diagnostics page for this asset is then shown:
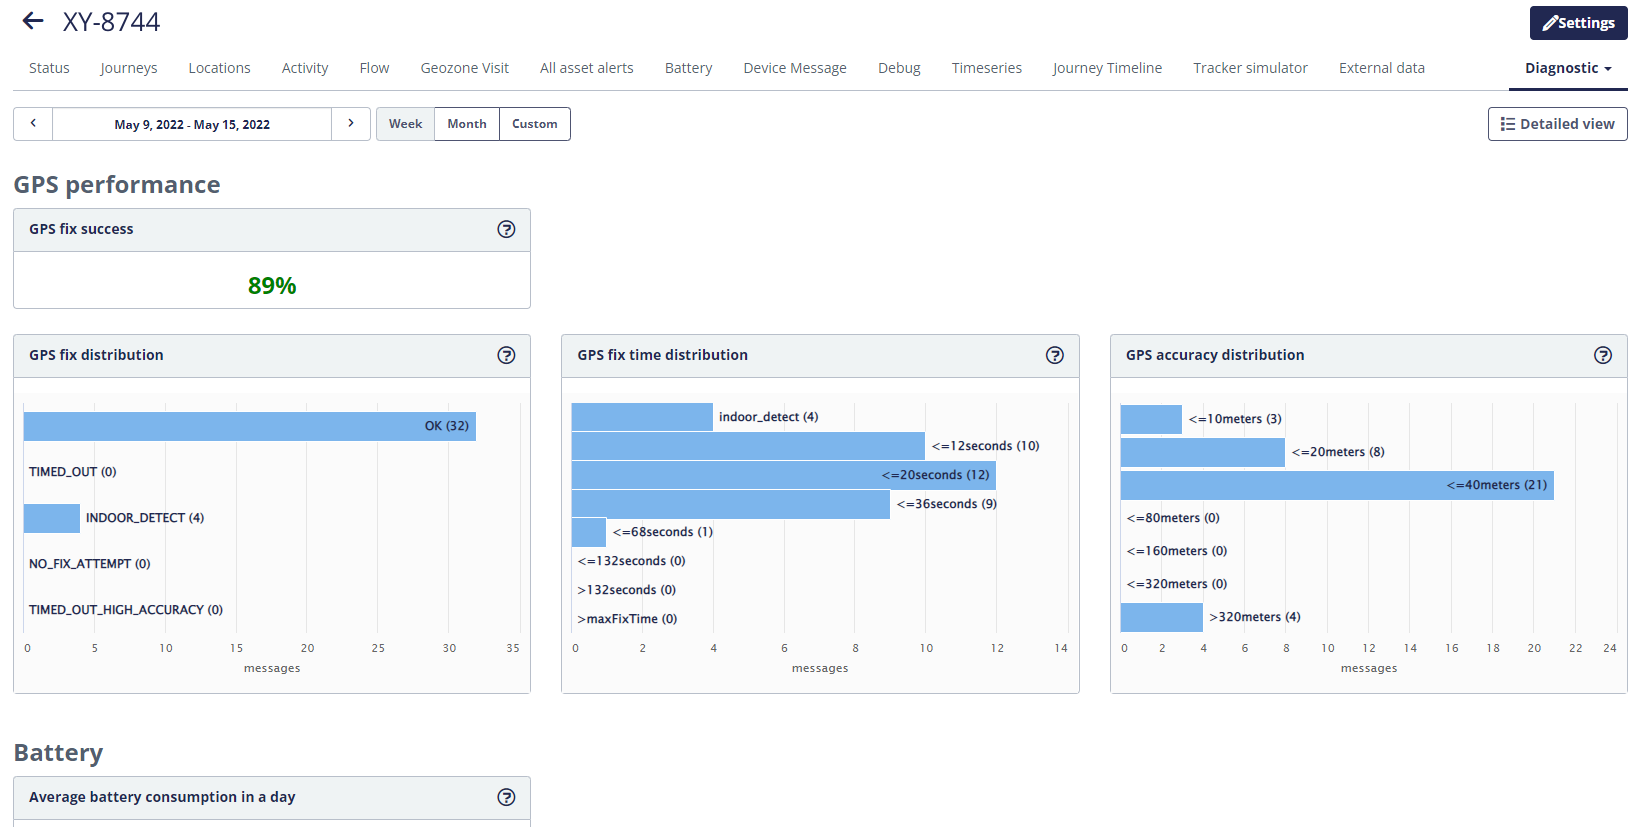
This page shows quality metrics for the given tracker in a selected period of time.

A more detailed view for these quality indicators can be opened by clicking on the  button.
The Diagnostics detailed view for this tracker will be displayed:
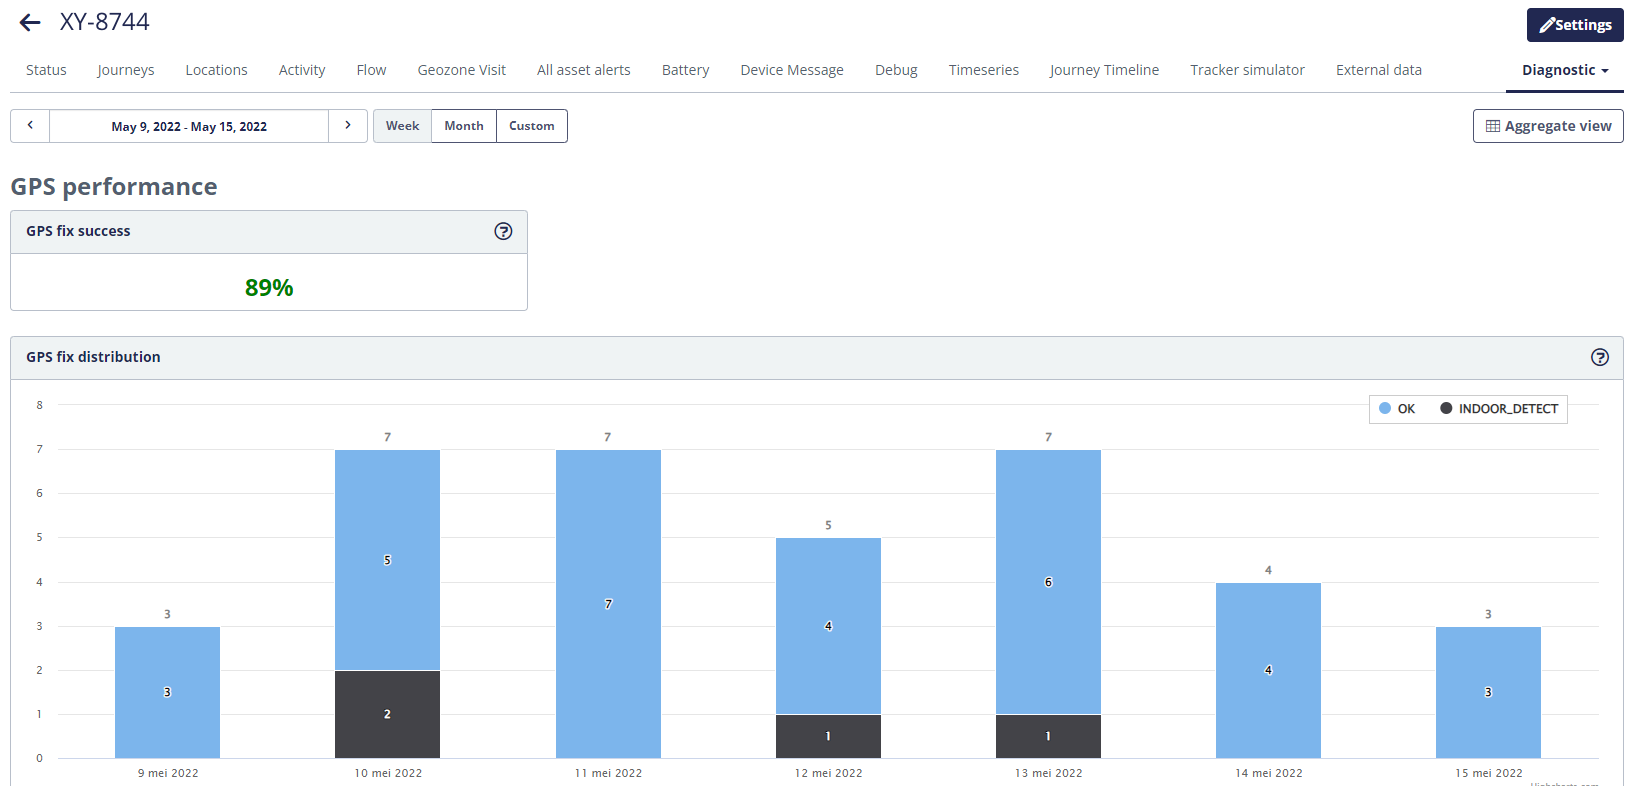
To go back to the overview page, click the  button.
Tracker battery diagnostics
The tracker battery diagnostics page can be accessed by going to the Asset View mode (follow the steps described in this task) and by clicking on the "Battery" tab:
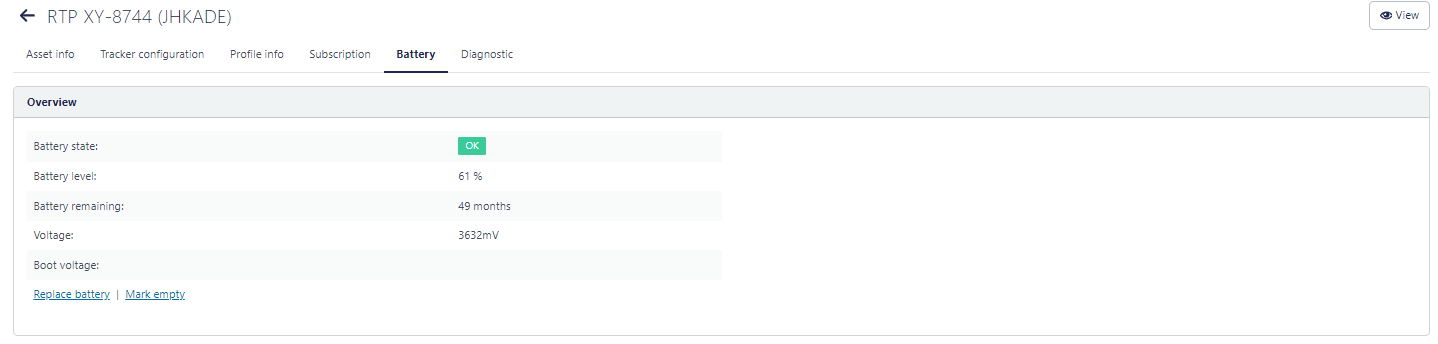
The Overview section shows the following high-level metrics:
- The estimated battery level of the tracker in percentages. This estimation is based on the recorded behavior of the tracker. For a tracker that is online most of the time, this estimation is accurate as it is based on the actual recorded historical behavior of the tracker.
- The estimated remaining battery autonomy in months. This estimation is based on the actual estimated battery level, and assumes that the tracker will behave in the same manner in the future as it behaved in the past, to make a prediction of the remaining autonomy.
The next section shows the evolution of the battery consumption over time:
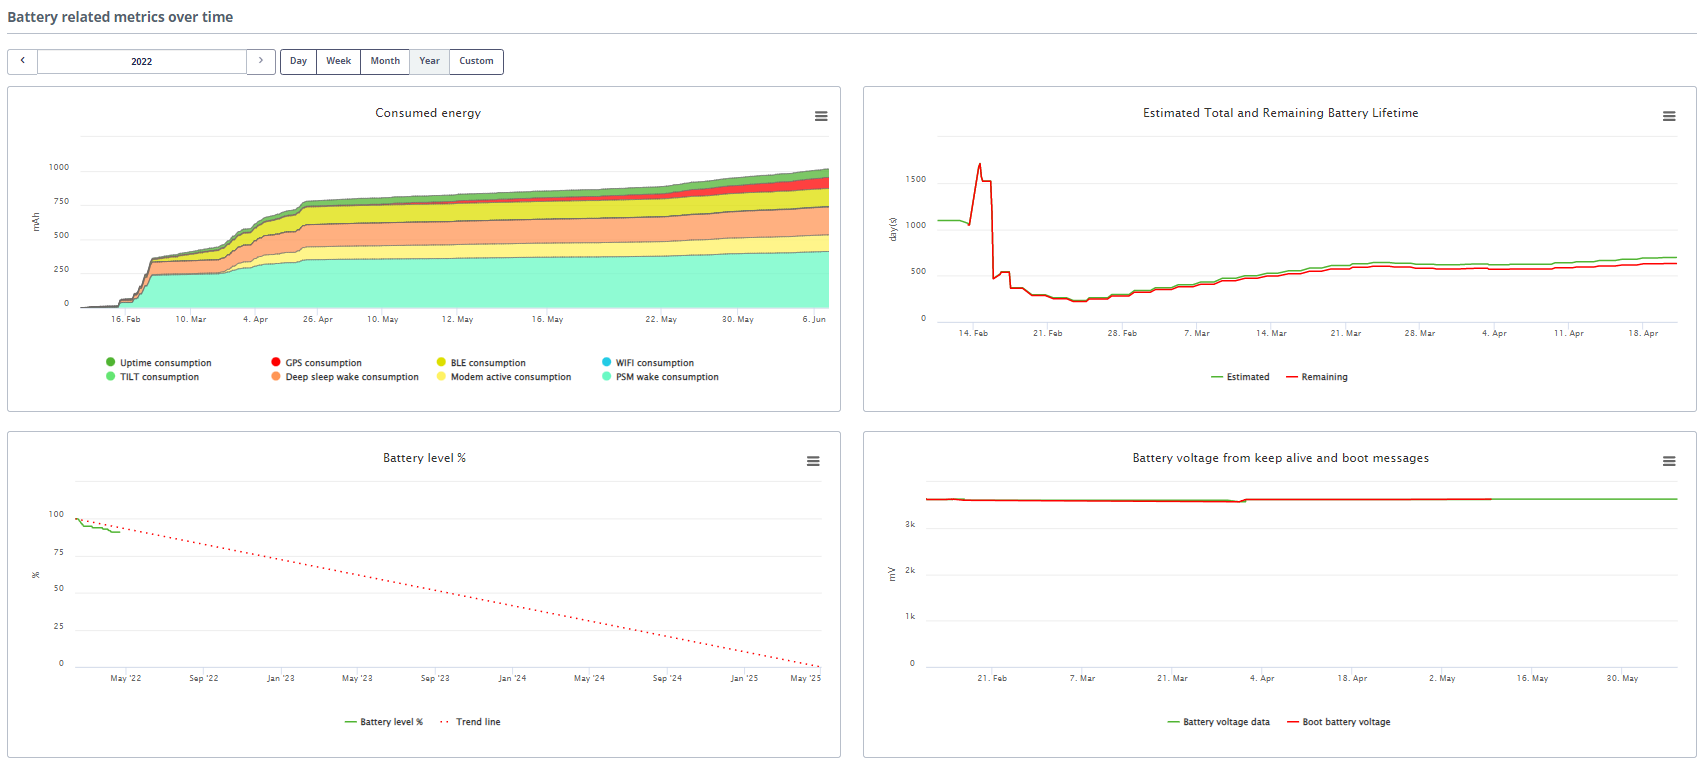
This section displays the following widgets:
- Consumed energy: this graph shows the evolution over time of the consumed energy (in mAh) for each of the main functions of the tracker. This allows one to understand which of the tracker's features is responsible for how much of the consumed energy.
- Estimated total and remaining Battery Lifetime: this graph shows the following
two metrics:
- Green line: the estimated total autonomy of the tracker (in days). This is the estimation of the total time that the tracker will have worked using its battery, from the moment of activation until the batteries run out.
- Red line: the estimated remaining autonomy in days. These are the number of days left until the batteries run out.
- Battery level: this graph shows the evolution over time of the battery level of the tracker. This also shows a trend and an indication of when the tracker batteries will be empty.
- Battery voltage: this shows the evolution over time of the voltage of the tracker battery. For most battery types, the voltage remains stable for most of its lifetime and then suddenly drops to lower values. A significant decrease in this value indicates that the tracker batteries will rapidly run empty. The battery voltage is reported both in daily keep-alive messages as well as in the BOOT message sent by a tracker when it starts up (for example after a battery replacement).
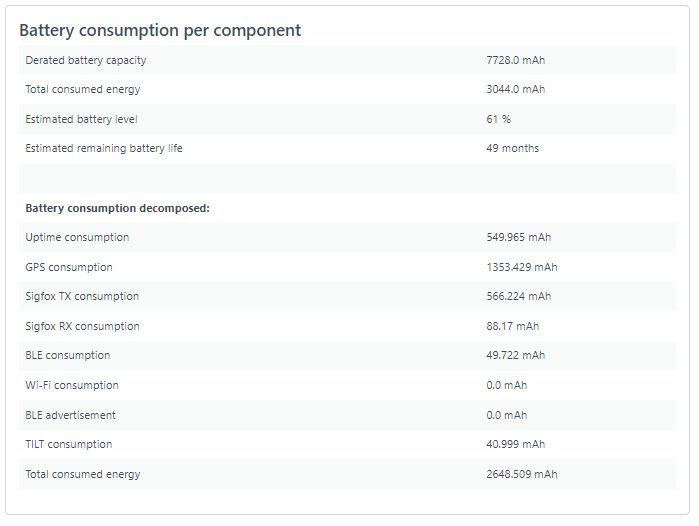
The last section shows the battery consumption of the tracker for each of its main functions: