Geozone best practices
Recommendations and frequently asked questions when working with geozones.
How should I draw geozones?
- Always take into account the an location information provided by a tracker may not always be 100% accurate. A precise localisation acquisition may occasionally fail and fall back to a less precise measurement.
- Draw geozones that are sufficiently large. It's often not really necessary to draw each corner and edge to be fully accurate to the site's dimensions.
- Avoid closely adjacent geozones. It is better to leave some distance between them.
- In most cases, overlapping geozones are only useful when modelling a location hierarchy (a high-level large geozone consisting of smaller geozones).
Use geozone tags to classify geozones
Geozone tags give extra information to the end-users, make it easy to manage, and enable more advanced functions. See Manage geozone tags on how to do this.
Create geozones for zones of interest and process steps
Geozones can be used for location purposes only, but if can also be used to gain insights in the flow of assets through a business process (See geozone live stock view and single geozone dwell times).
Coping with low accurate locations on geozone visits
Low accurate locations in combination with 'small' geozones could result an asset to jump in and out a geozone. This results in multiple geozone visits and wrong conclusions made on the location of the asset in the geozone as they are defined as outside the geozone and broken geozone visits. While there is actually only one long geozone visit they are detected as multiple shorter geozone visits.
The jumpers problem generates such a geozone view:
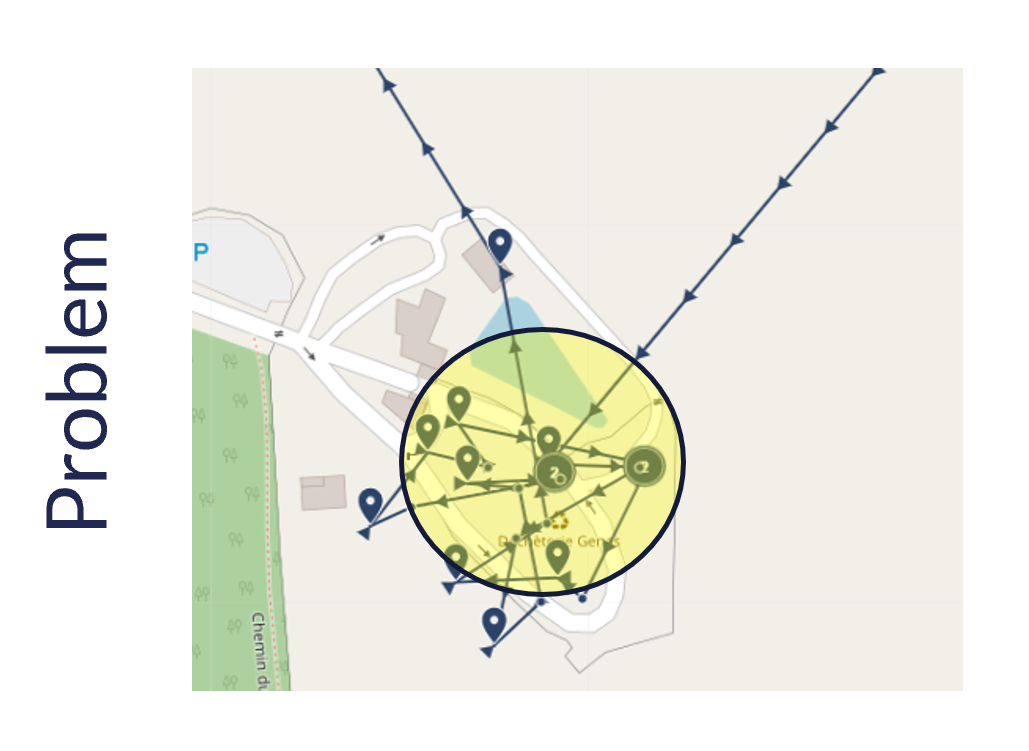
To solve this problem Sensolus created a set of pre-processing algorithms, but as a user you should
- Create bigger geozones.
- If possible, use geobeacons.
When the number of assets in a geozone is different if you look to the asset map or the single geozone dashboard
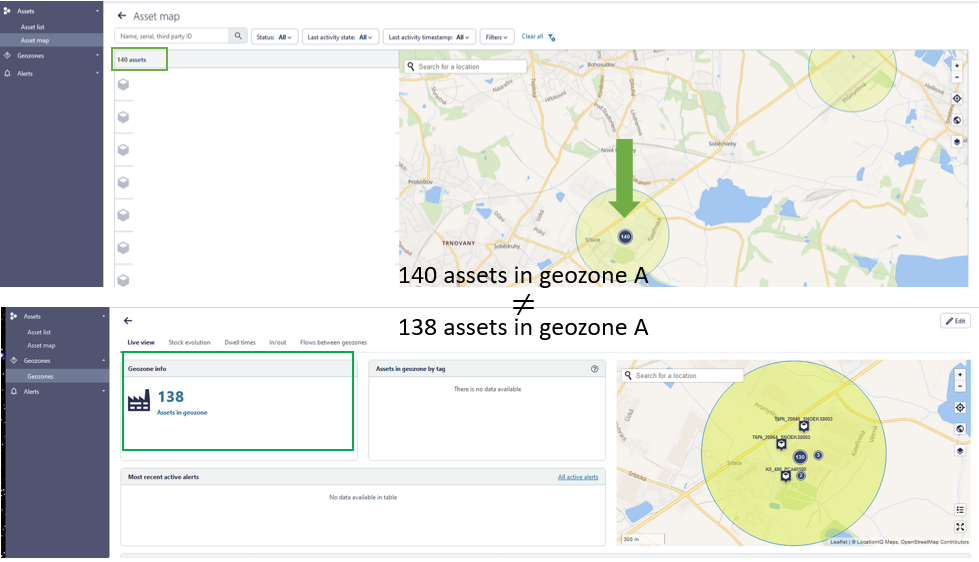
This is not a mistake but can be explained.
The 2 "missing" trackers on the single geozone dashboard are trackers that get their location from a network triangulation. These trackers were not able to receive a location from GNSS/Wi-Fi/BLE and therefore use the back-up of getting a network location. The configuration of the usage of the different location technologies can be found in the tracker profile.
The trackers that get their location via network triangulation do not have a precise location but are only given a circle wherein they are (can be any place in the circle). On the platform we do not show the network circles of these assets, but in the case above the network circle and the geozone (circle) are partially overlapping. Therefore on the map they are counted in the same cluster as the assets in the geozone. On the single geozone dashboard this doesn't happen.
Why is the column "additional info" empty for 'Outside geozone alerts'?
The column "Additional info" has as goal to give information on which geozones the tracker enters. This is relevant for "Geozone inside alerts" because you can define more than one gezone in the "inside geozone alert" and you want to know which geozone is causing the alert.
For "Outside geozone alert" you may define more than one geozone in the configuration as well, however, the alert is only triggered if the tracker is outside all chosen geozones. So, it not relevant to show information in the "Additional info" column here.